Everyone wants to see their instrumentation perform at its peak, but all too often, the instrumentation is not the weak link in an analytical strategy. We see this in WDXRF and XRD, but recently had the opportunity to work with a client on their OES sample prep. This large steel mill has been using an automated Herzog sanding machine for many years. I’ve seen it in action and it’s a truly impressive tool. The engineers at Herzog have decades of experience building automated prep solutions and definitely worked hard on the design. However, speed was the key factor when this method was developed. There are few ways to prep a metal coupon faster than running it against a sanding belt. The sanding method had the added benefit of an extremely hard cutting medium (usually Al2O3) which meant that a single preparation procedure could be used for all steel grades and even worked when careless workers chose to water quench hot samples rather than allowing them to temper a bit by cooling in air (making them extremely hard). The downside of this method comes down to surface quality. Sanding will always leave a rough surface with linear troughs/grooves which create a variable surface area as well as shadowing. These effects are detrimental to light element sensitivity and as tolerances are tightened, the lab supervisors were forced to look to other methods.
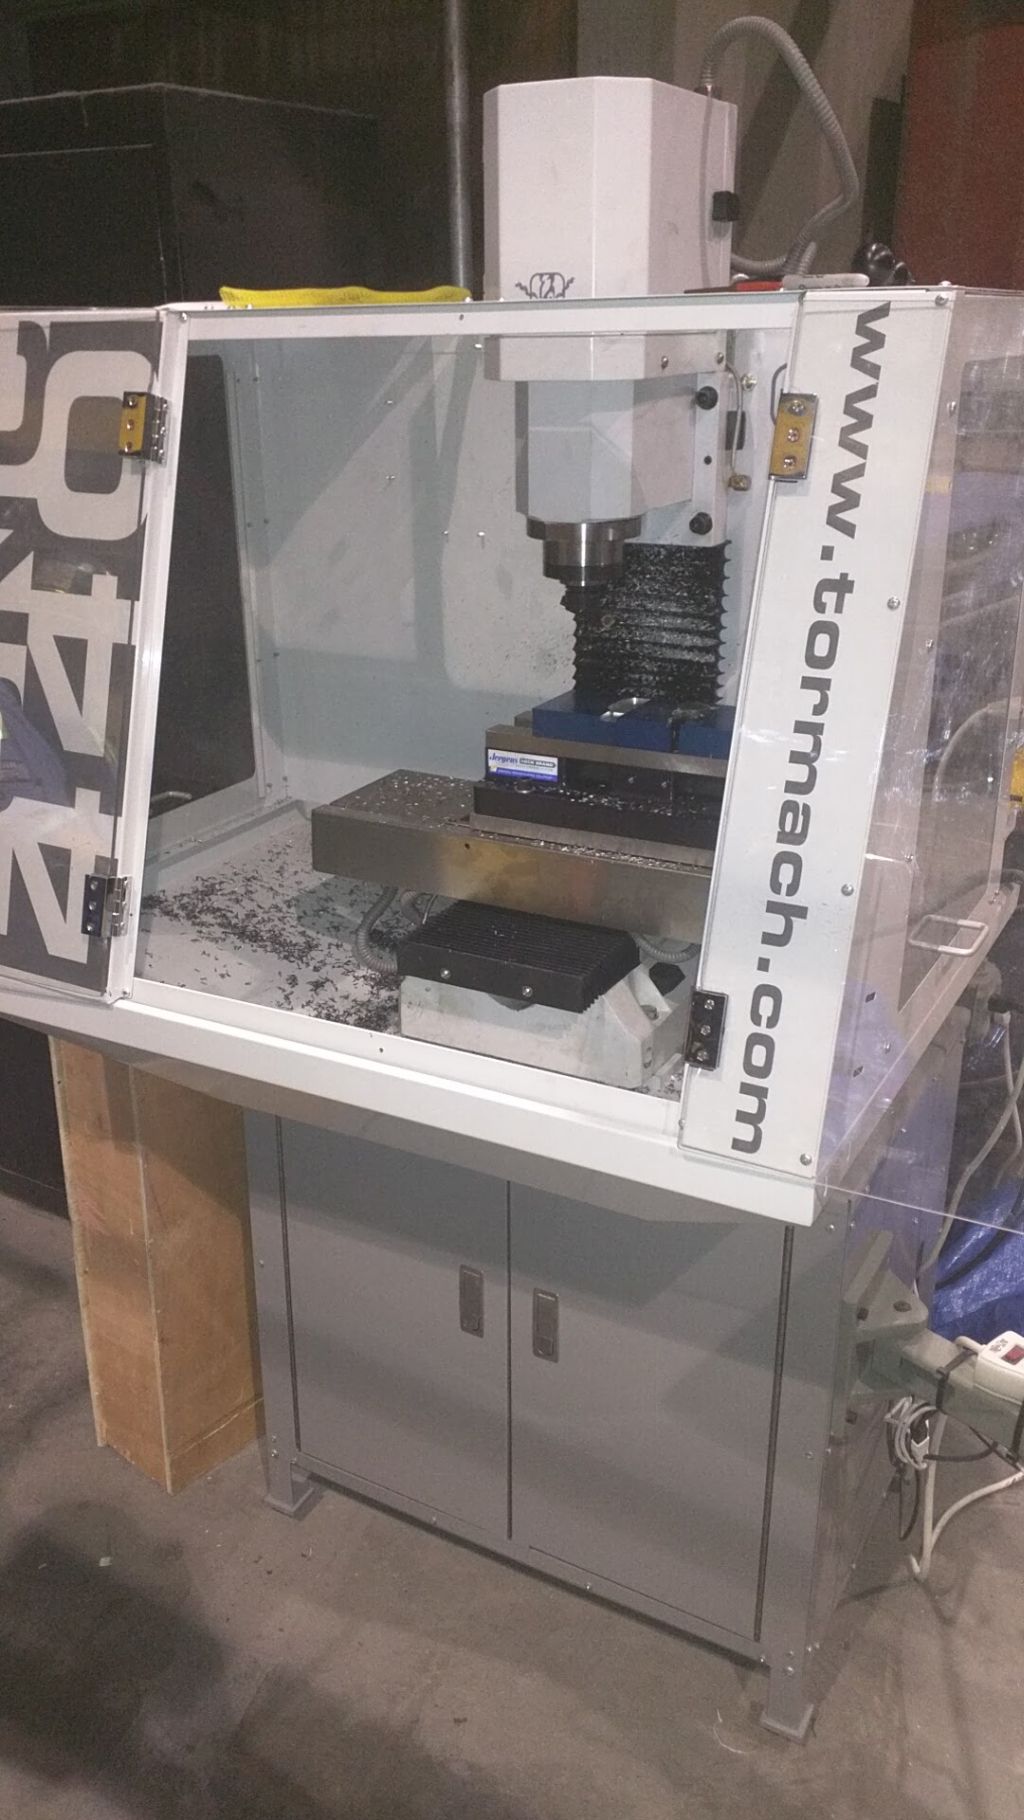
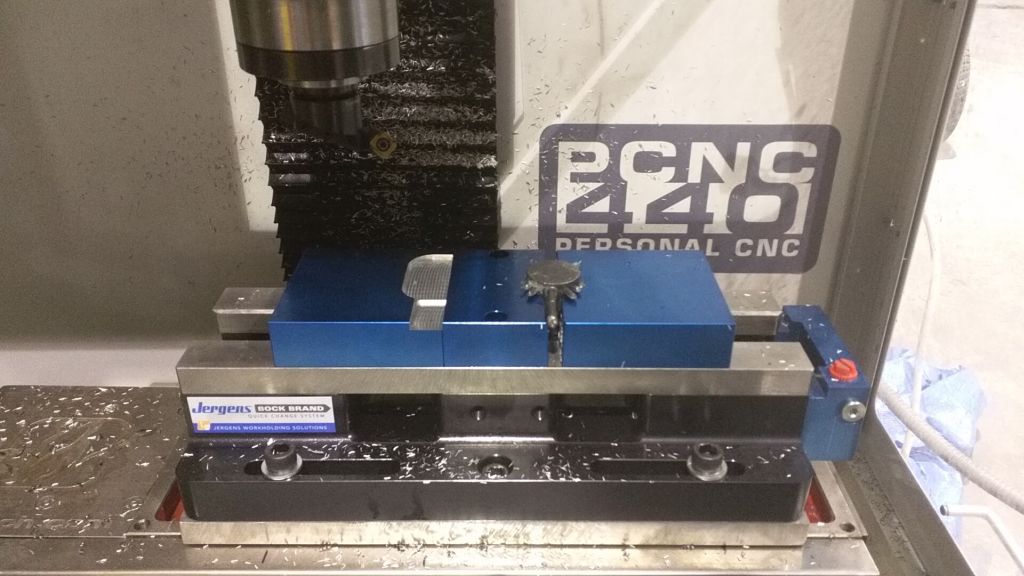
We began talking about this project over a year ago when the WDXRF user mentioned the lower detection limits that were soon to be implemented. I’d had some experience with sample preparation by milling, but usually more exotic alloys. There are certainly more than a few options available for automated milling, but their high cost and space requirements put them out of the running for this situation. My recommendation was to purchase a lower level CNC milling machine and automate as much of the process as possible to simplify operation and limit opportunities for error. I’m happy to say that the first tests earlier this month were a great success. The coupons come out with a very smooth surface in about the same amount of time it took to run through the sanding machine before.
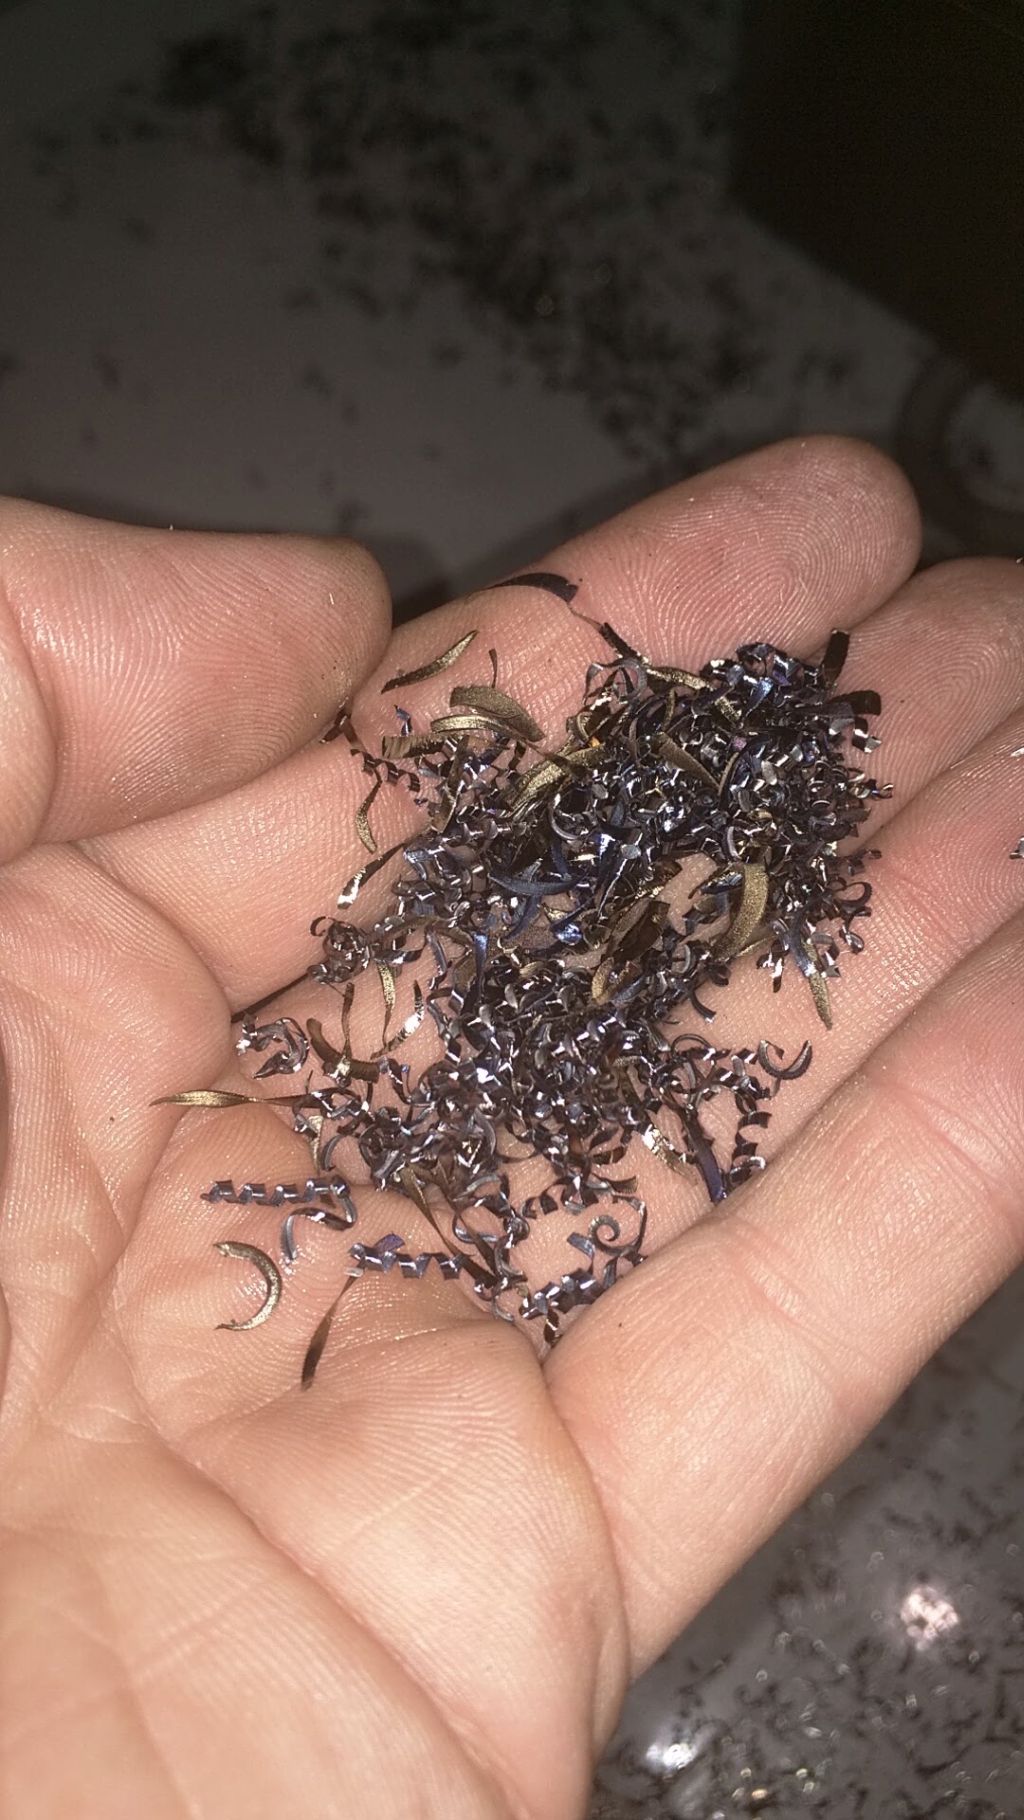 There are still some things that bear consideration with milled samples. Not the least of which is contamination from the cutter. This client is unlikely to be bothered by Al2O3 from their sanding media, but small amounts of Tungsten Carbide steel (WC) rubbing into the surface could present an issue as cutters wear out. Luckily, the tools we’re using are indexable and not too expensive which allows users to change cutters frequently. It’s important to maintain a sharp edge and correct settings for this type of work in order to avoid “rubbing” through the material. This occurs when the tools is rotated too fast or fed too slowly. Material is pushed out of place rather than being cut. This causes contamination, premature tool wear and smearing of the surface. All of which have a detrimental effect on the analysis. I spent a solid day working out the initial conditions and there will still likely be many adjustments and changes before this becomes the primary production method.
All in all, this was a great project to work on. The improved detection limits will dramatically improve their analysis of light elements, the automated vise and mill will make it even easier and faster to prep material than before and we’ve done it all at a fraction of the cost expected. One thing I should note here is that this particular milling machine was chosen due to its exceptionally small size and low cost which were key requirements of this job. Given a less restrictive environment, I would have recommended a much different solution.