AN ANALYTICAL XRAY SERVICES LABORATORY
Feel free to call us: 940-784-3002

All of the powder XRD (PXRD) systems we work with use either manually interchangeable aperture slits or automatic (stepper motor driven) slits to control divergence and scatter. One of the most common questions I hear from new users is “What is the ideal slit arrangement”. While I realize that there are many instruments out there with “one-size fits all” slits, the D500, D5000, D5005 and D8 optics are what I call “Research Grade”. This means that they can be adjusted and tuned for a particular application to maximize effects that are desirable and minimize those which are not. One of the most common reasons to change the anti-scatter and divergence slits is to reduce scatter over the sample at low angles. This scatter is the primary limiting factor for users who want to see diffracted peaks at very low angles. At Texray, we offer instrument time (data collection) as one of our services and have received requests for starting angles as low as 1 degree 2theta so it occurred to me that now would be a good time to collect some reference data and answer this question once and for all.

The image on the left shows the effect that the anti-scatter and divergence slits have on low angle scatter. The image on the right is of the two primary reflections of quartz (Novaculite) with the same slits. Note the intensity loss. The benefit of automatic slits is that they can be set very small at the beginning of the scan and gradually open up throughout the angular range. Very few users need that kind of flexibility, but since we’re talking about slits, it bears mentioning.

Low angle scans with various slits

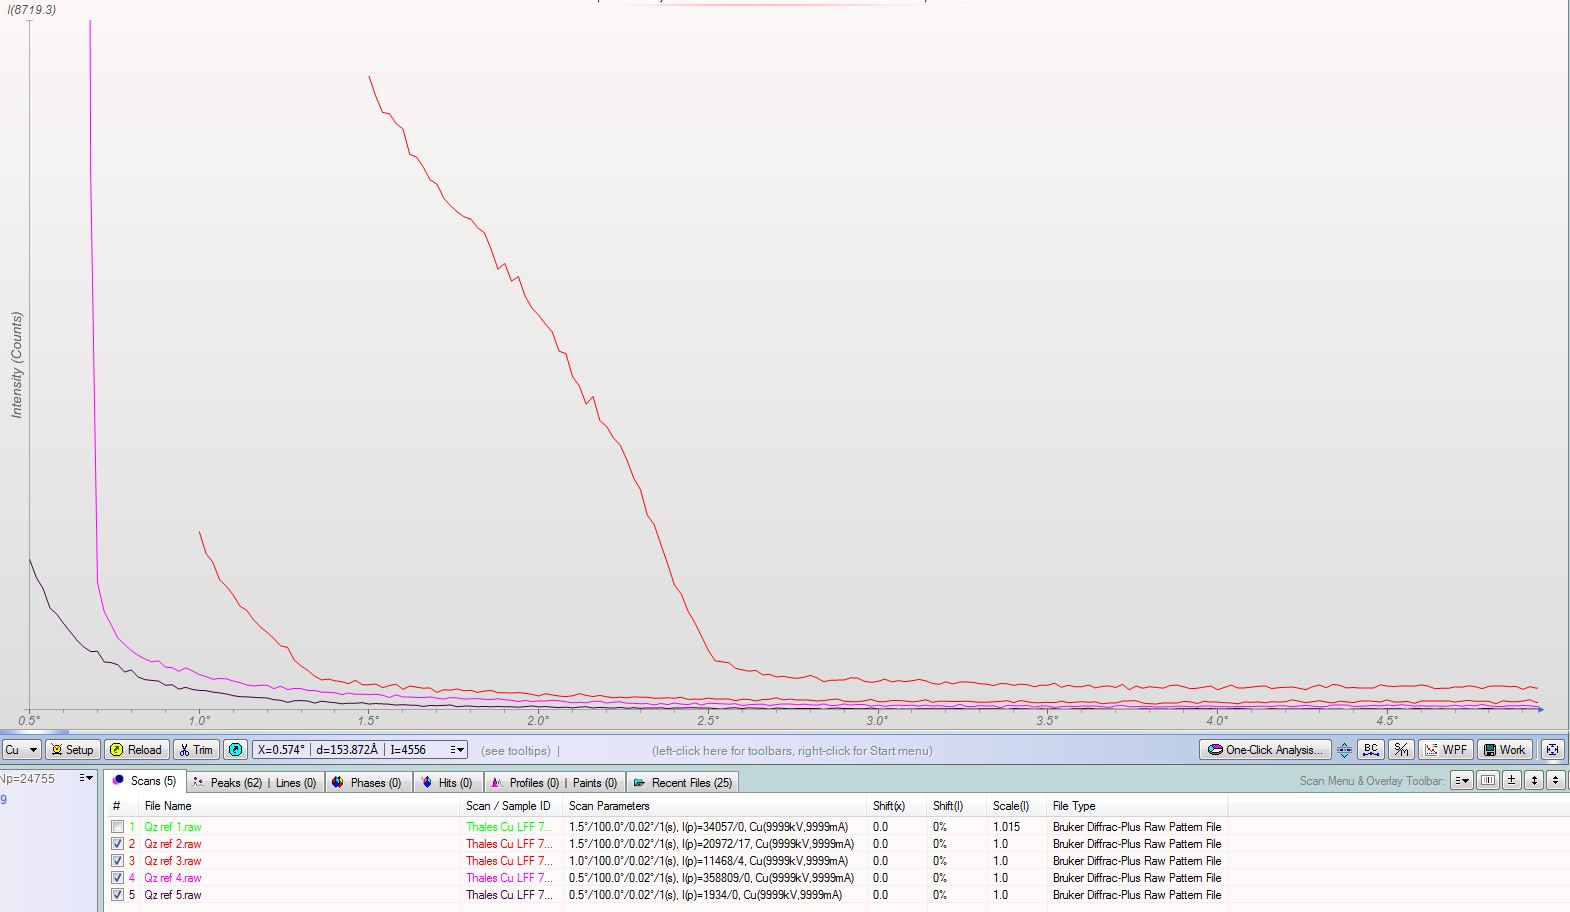
This data was collected with matched slits set at 0.2mm, 0.6mm, 1mm and 2mm. These correspond to practical starting angles of 0.6, 0.9, 1.4 and 2.5 degrees 2theta respectively.

Low angle scans with various slits PEAK COMPARISON

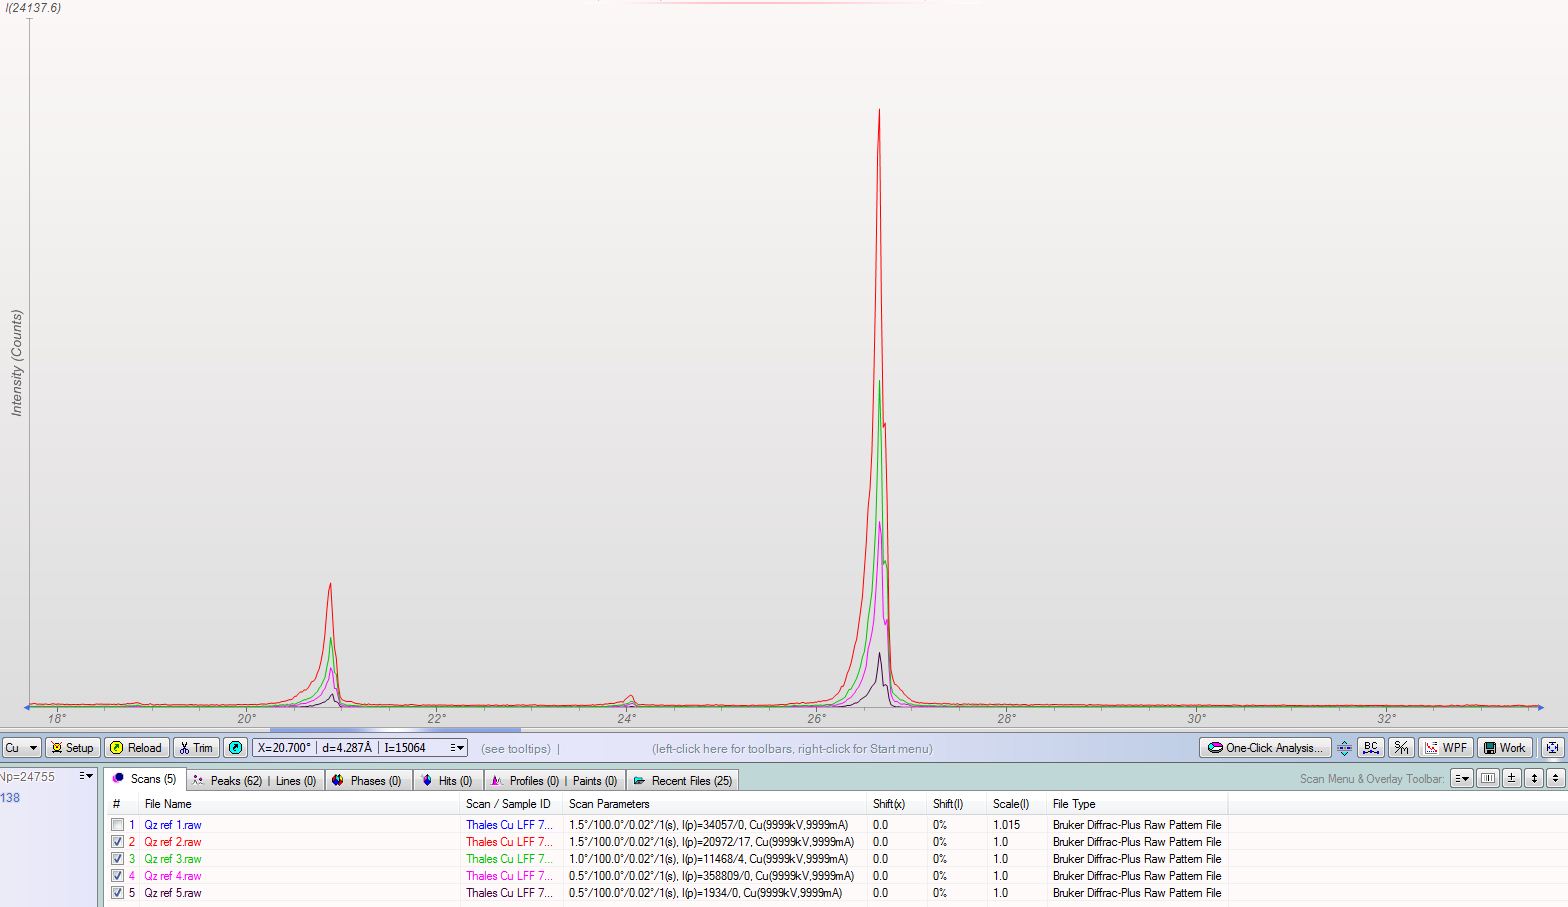
Looking at the actual peaks, you can see the affect the smaller slits have on the rest of the data. These were collected without the benefit of a diffracted beam monochromator and with the primary soller slit removed. Neither of these factors would have a dramatic impact on the result, but the lack of a primary beam soller slit explains the asymmetrical peak shape in the second scan range pictured.


XRD work is categorized into two major groups. Single crystal and powder analysis. While single crystal work is usually highly customized to particular applications and involves a largely unique hardware set, powder (PXRD) work covers a broad range of applications. Many of which can be performed without any special hardware at all. Perhaps it would be more accurate to call it “Randomly oriented small particle” diffraction. Somehow I think “ROSPXRD” would be slow to catch on. At the risk of oversimplifying the options, I’d like to take a few posts to showcase some of the more common analyses which can be performed with a basic PXRD system and perhaps a few that require minimal additional attachments.

This is an example of a Bruker D8 Advance configured in its most basic PXRD state with only a scintillation counter, sample stage and source.

This is an example of a Bruker D8 Advance configured in its most basic PXRD state with only a scintillation counter, sample stage and source.

This is the same D8 base instrument configured for single crystal XRD. Note the Chi, phi, XYZ stage, area detector (2D) and Goebel focusing mirrors.

This is the same D8 base instrument configured for single crystal XRD. Note the Chi, phi, XYZ stage, area detector (2D) and Goebel focusing mirrors.


My last post involved a basic phase identification and this seemed like a great place to start. Most PXRD users are asked to identify some unknown bit of corrosion, rock or contaminant at some point. I once took a shot at something which later turned out to be sewage sludge ash. I have no idea what they hoped to find in that. Exotic, mundane or distasteful, the most basic XRD can collect the necessary data to perform this analysis. Phase ID is usually the first step most users take toward more advanced software. In addition to the simple pattern analysis features that usually come standard, you’ll need an engine designed to search one of the many commercial or open-source databases available. The ICDD, NIST and AMCSD are probably the most popular with several others on the fringe. There are even user-developed databases which are usually compiled in a particular lab to cover the range of phases they expect to see based on their product or application.

Limiting the search to categories of phases which are likely to be present greatly improves the relevance of the results list. There’s obviously no reason to search through a huge list of minerals when trying to identify a metallic oxide coating. Hit lists can also be refined based on data from other sources such as qualitative elemental analysis. We use our WDXRF systems and the built in elemental filter in Jade to trim the options substantially.

Any good search/Match engine will have support not only for multiple databases, but also offer the option to limit your search to certain subfiles which are group my material categories.

Any good search/Match engine will have support not only for multiple databases, but also offer the option to limit your search to certain subfiles which are group my material categories.

Semi-quantitative or simple qualitative elemental data can be used to eliminate a large percentage of erroneous hits so the analyst can focus on only pertinent options. We prefer to bundle an XRF scan with any Phase ID project.

Semi-quantitative or simple qualitative elemental data can be used to eliminate a large percentage of erroneous hits so the analyst can focus on only pertinent options. We prefer to bundle an XRF scan with any Phase ID project.


Isolating the valid hits from erroneous is where experience comes into play. Non-ideal particle size, preferred orientation and crystallographic imperfections can make the process quite difficult. Relative peak intensity ratios, peak width and sometimes even the complete absence of a particular peak which would theoretically be present all present opportunities to gain additional insight. Sometimes this is relatively easy as in the case I presented in the previous post, but other situations are not so simple. These difficulties are amplified in the case of low concentrations and complex mixtures.

This is a great example of Phase ID the way we all wish it came out. The peaks are sharp, intense and located right on their theoretical angle.

This is a great example of Phase ID the way we all wish it came out. The peaks are sharp, intense and located right on their theoretical angle.

This is an example of something a little harder to nail down. Overlapping peaks, several additional phases and a highly imperfect sample. Refining the options based on external measurements and in depth sample prep make the difference between success and failure in cases like this.

This is an example of something a little harder to nail down. Overlapping peaks, several additional phases and a highly imperfect sample. Refining the options based on external measurements and in depth sample prep make the difference between success and failure in cases like this.


XRD pattern analysis has come along way in the last 40 years and most of the major improvements have come on the heels of increased computing capability which enables us to perform exhaustive iterative calculations on complex patterns quickly and at comparatively low cost. However, there is nothing on the market as of now which has made an experienced analyst obsolete.


I stumbled into Dondero’s Rock Shop a few weeks ago and struck up a conversation with the owner. He had been interested in geology all his life and was now operating a very nice shop in North Conway, NH with just about every type of mineral one could imagine on display. It was a great opportunity to have an expert identify a few specimens my boys had collected the previous day and he was more than happy to help. These were very large single crystals of relatively common minerals, but it was obvious that experience makes all the difference when one is trying to identify them by sight. I offered to return the favor by collecting XRD data on anything that ever managed to stump his well trained eye and he immediately brought out an interesting sedimentary formation which he’d sliced into cross to sections. He had been very curious about its composition and I brought home a sample. My technical expertise is primarily in the hardware we use at Texray while the real science is handled by other, more highly skilled hands, but this seemed like a fun little project and good practice if nothing else.

Geological samples are particularly difficult to analyze by XRD as they contain various defects which are difficult if not impossible to model based on theoretical data. Our precious Rietveld refinements roll off of this type of data like water off a ducks back all too often and we’re left wondering how on earth this mud could be mistaken for moon rocks. As wonderful as Rietveld is in well-trained hands, we tend to rely much more on comparative data when we’re working with this type of sample. We can thank Dennis Eberl of USGS in Boulder, CO for bringing RockJock into the world to solve exactly these types of problems. RockJock is relies on what’s called RIR. That is Relative Intensity Ratio analysis to provide both qualitative and quantitative results. The  algorithm has been massaged into a number of commercial products in an effort to improve the user interface and add additional functionality, but the core of all that is still readily available on the internet for anyone interested to download. If you’re interested in something a little more user friendly, we offer ClaySim from MDI.

To the left you can see the data I collected after mild grinding. It’s not uncommon to spend several hours collecting data before it’s adequate for quantification or other advance analysis, but as we’re only interested in qualitative phase ID, this will more than suffice. I was quite surprised to find only two major phases present since the sample clearly shows four distinct layers with completely different coloration. The scan actually ran all the way to 120°2Θ, but the “action” is mostly concentrated at the lower angles. Hardcore geologist actually push the lower limit all the way down to 2.5°2Θ in an effort to catch a few illusive peaks. The analysis program you see here is MDI Jade 2010. It’s their flagship product and for good reason. Almost all of our users are running some form of Jade for their analysis and all have had nothing but glowing praise for it.

So it appears that the mystery rock was actually little more than Quartz and Dickite. It’s possible that there’s a bit of Kaolinite mixed in there as well, particularly because Dickite and Kaolinite share a chemical composition. The real fun started when I let Jade loose using a feature called “One Click Analysis”. This is as close to a “black box” as XRD analysis will ever get. With good data collected on a solid, well-aligned XRD, this little button can provide impressive results with no user input at all. It’s not the magic bullet for every situation, but in this case, it recommended yet another phase with the same chemical composition as Kaolinite and Dickite. Nacrite. Adding this into our phase list improved the difference pattern and allowed Jade to model nearly every bump in the pattern.