Energy-dispersive detectors have been in use on XRD systems for decades, but have always come with caveats. Low energy resolution, Liquid nitrogen cooling, slow start-up and tedious/cryptic tuning controls have limited their popularity in many applications. Silicon Drift technology solves most of these issues and modern electronics covers the rest. The new KSA-SDD system for X-ray diffraction utilizes a full spectrum EDXRF detector which is fully software tuned. The result is a detection system with high enough energy resolution to match the performance of the traditional diffracted-beam monochromator/scintillation counter combination without the inherent 75% intensity drop. The increased countrate allows for much faster data collection speeds with the same counting statistics. We’ve been using this technology at our in-house testing lab (Texray Laboratory Services) for several months to great effect while we refined the system and are now ready to open it up to all XRD users. Contact us to discuss options for integration into your diffractometer.
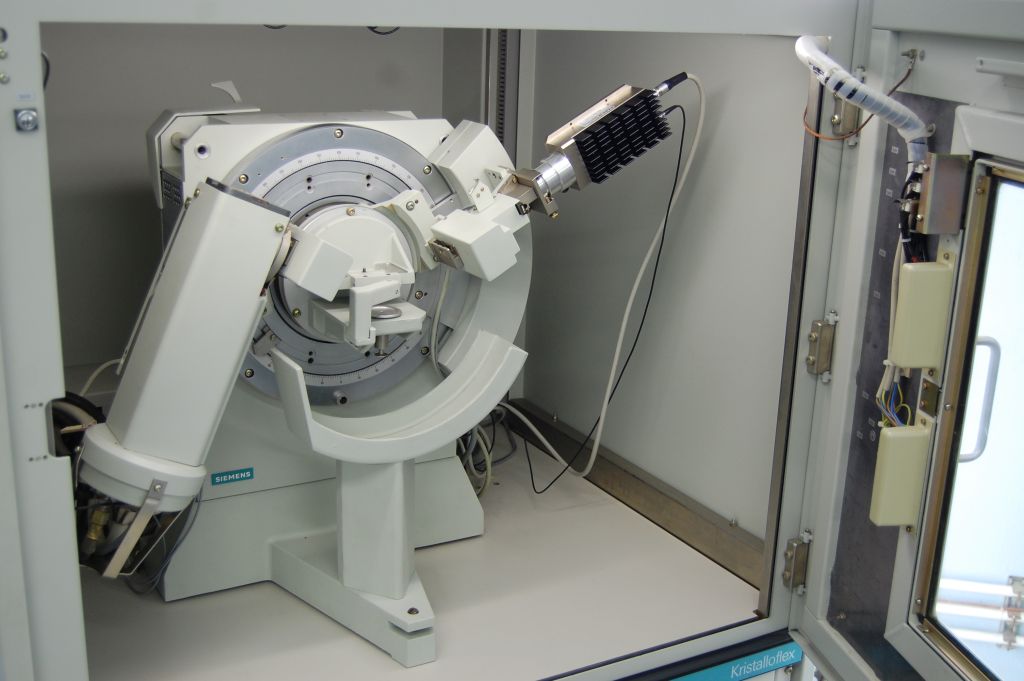
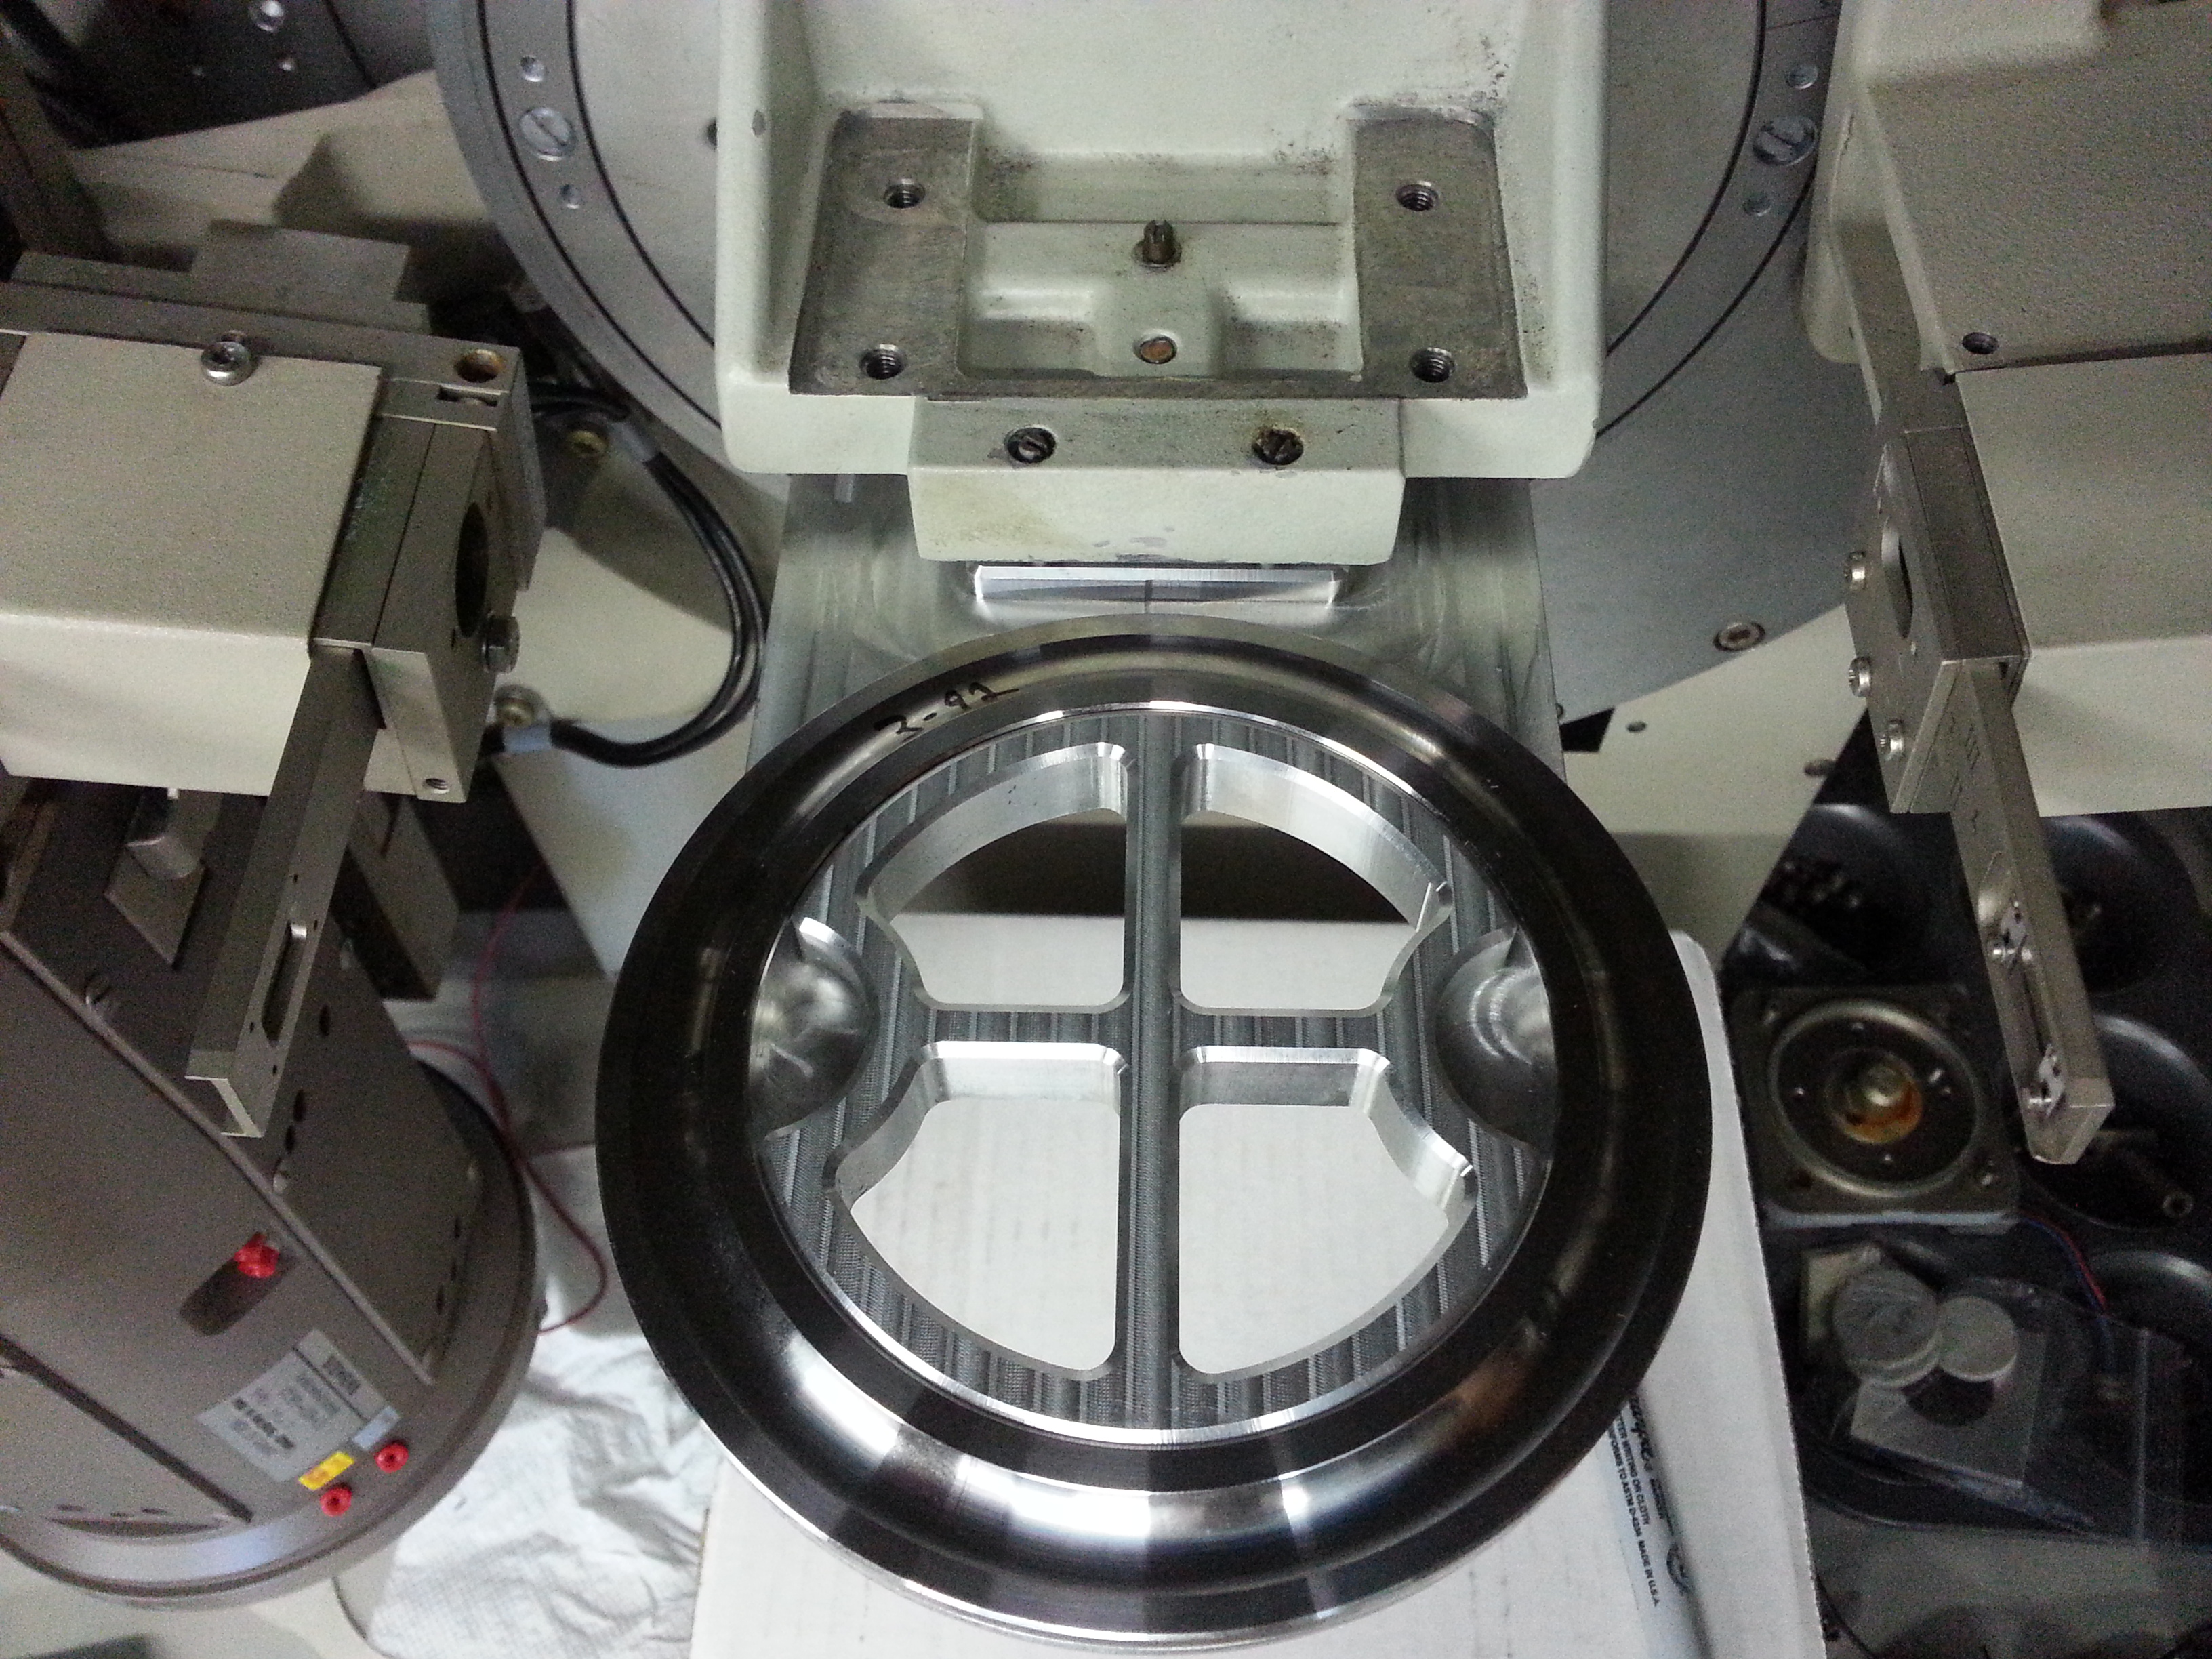
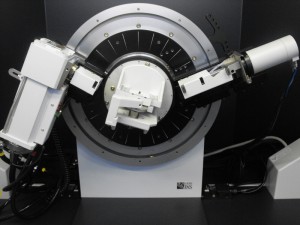
SDD-XRD-150 installed on a Siemends D5000TT PXRD system. This is one of the powder systems we operate at Texray-Lab.

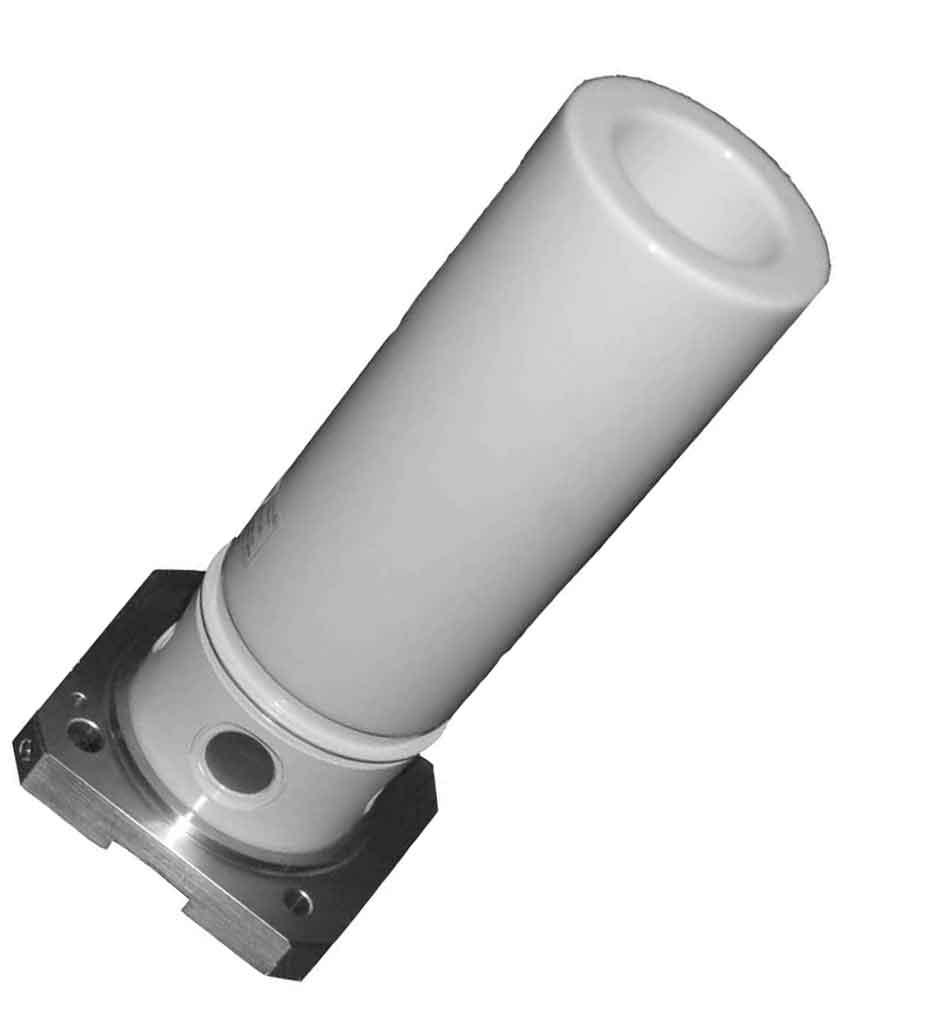
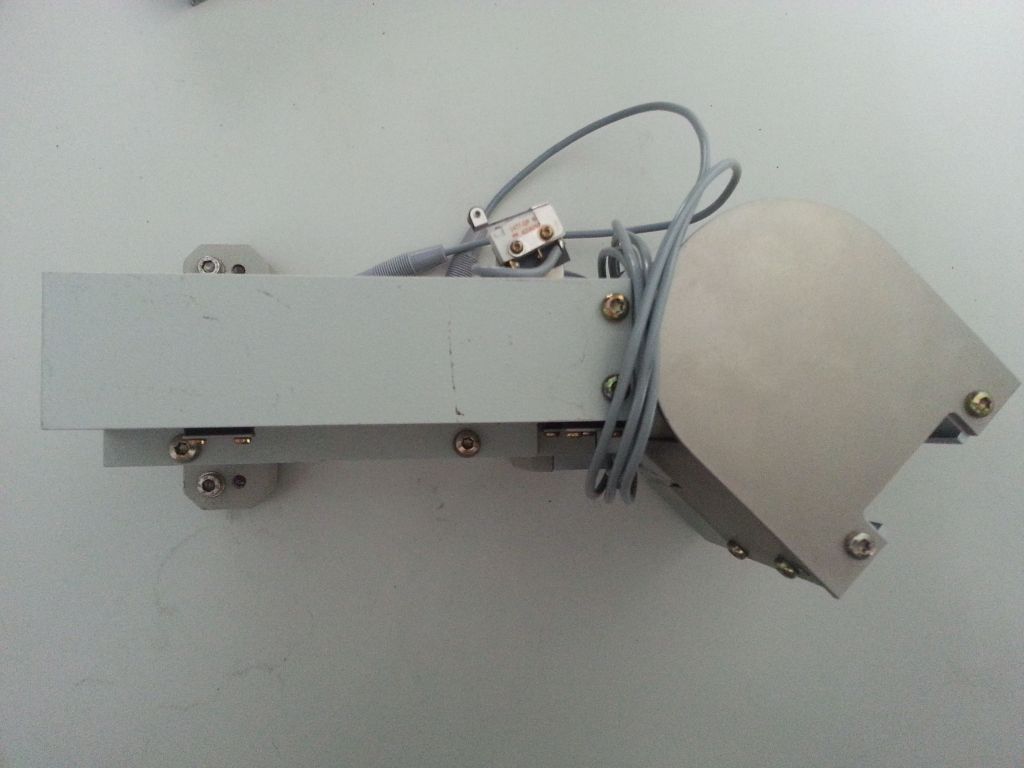
The detector mounts directly in place of the original scintillation counter.
Speed
- Scanning 3-4 times as fast as the traditional scintillation counter/diffracted beam monochromator yields nearly identical results.
- Scanning at the same rate results in much smoother scans, greatly improved statistical data and lower limits of detection/quantification.
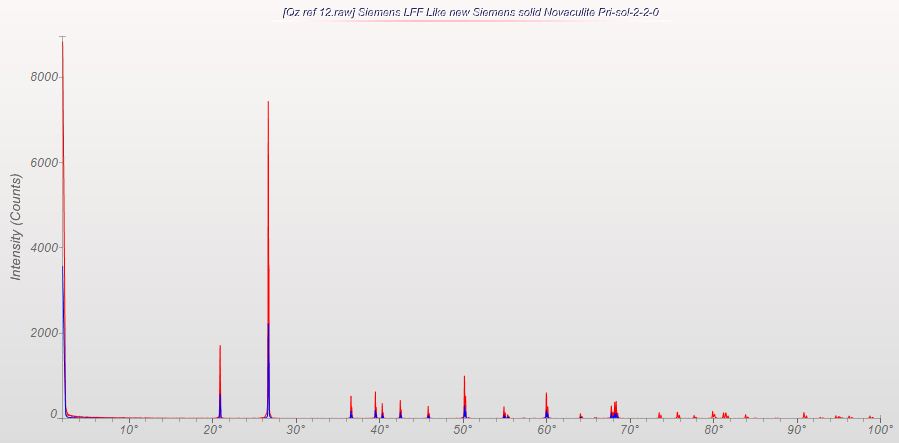
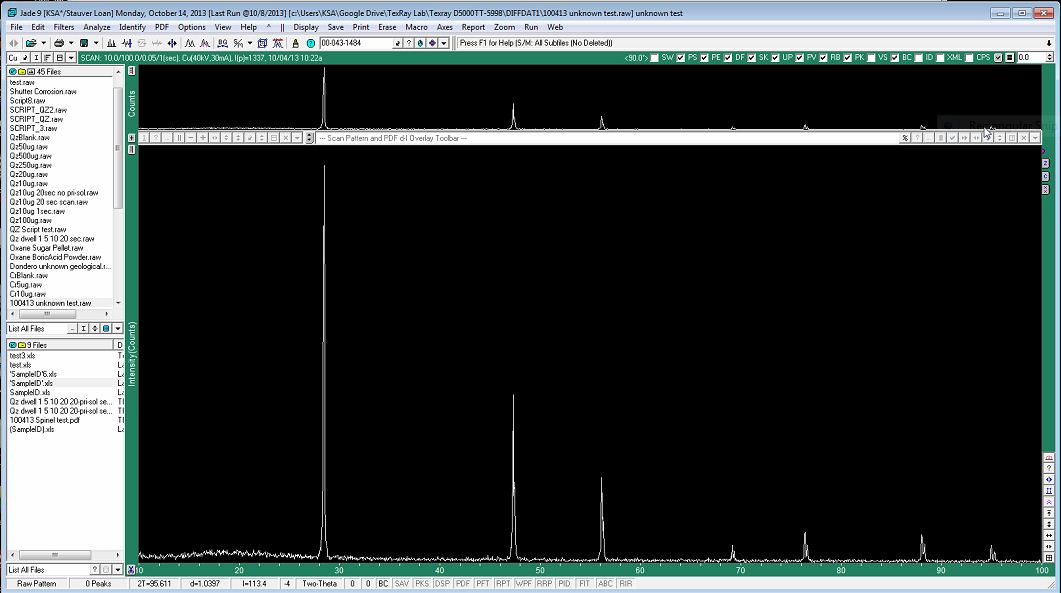
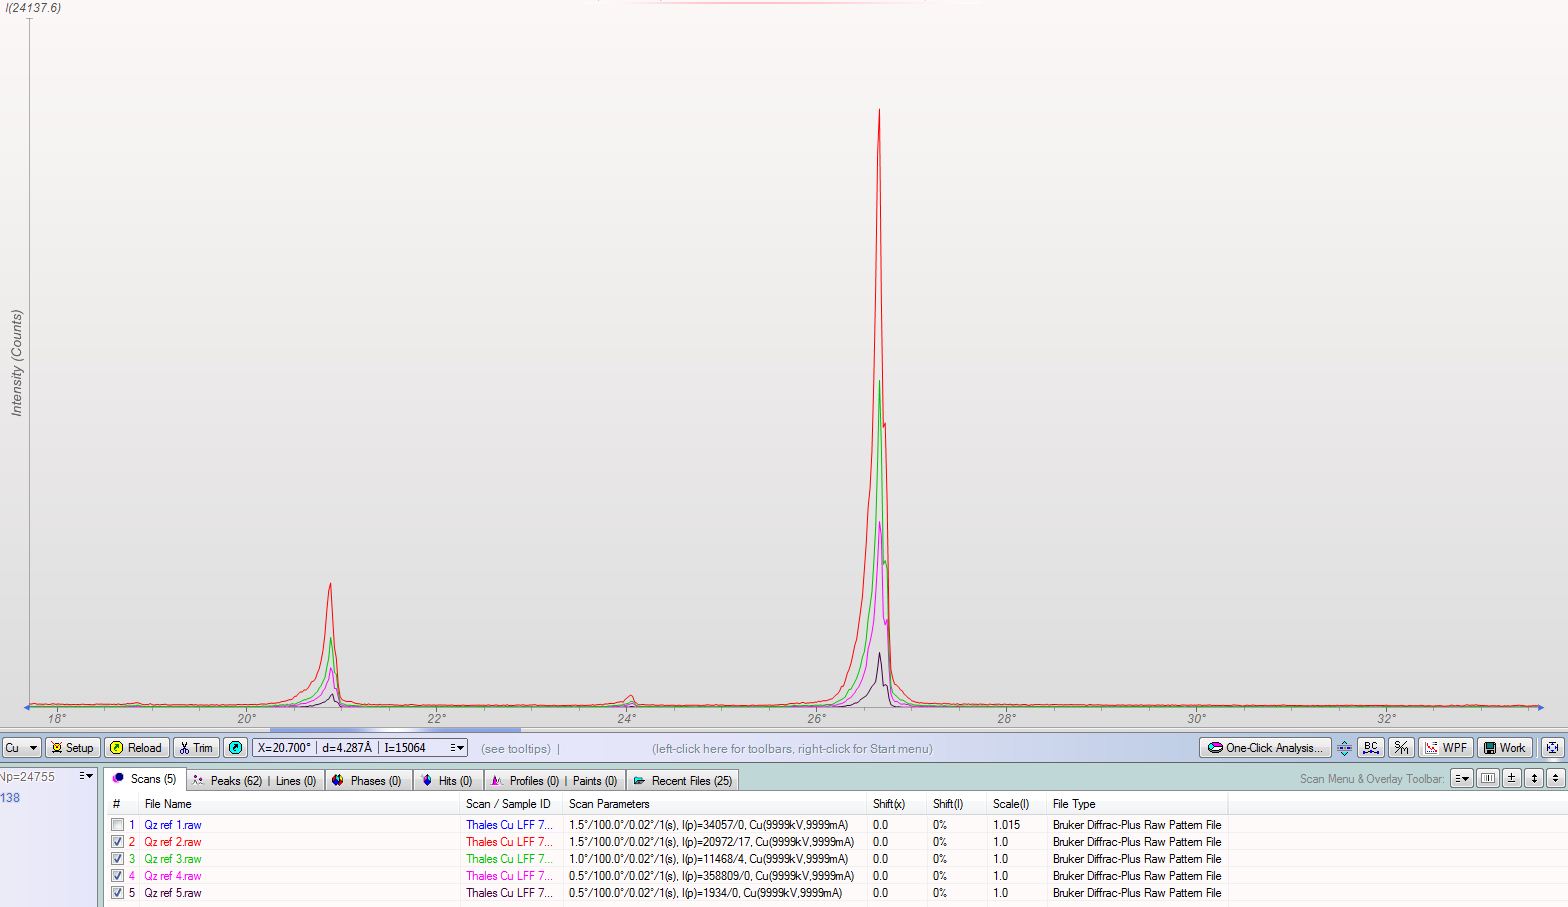
Complete scan of Novaculite Quartz with a diffracted beam monochromator and scintillation counter vs the new KSA-SDD-150.
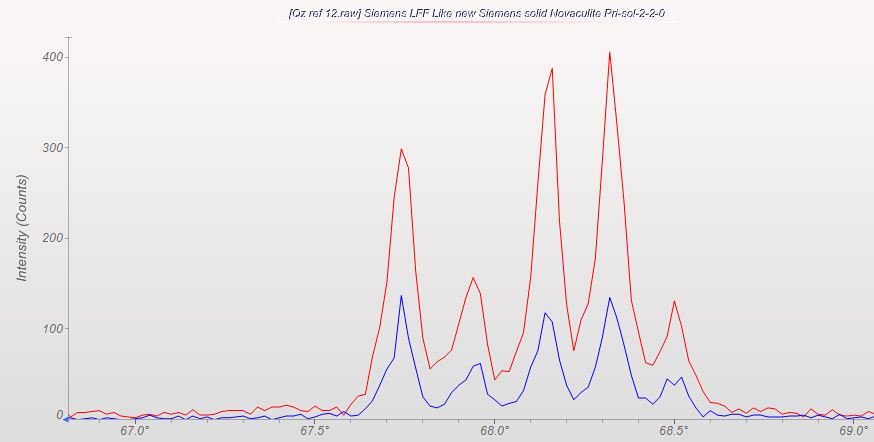
5-fingers of Quartz scan of Novaculite Quartz with a diffracted beam monochromator and scintillation counter vs the new KSA-SDD-150.
Energy resolution
- 140eV under ideal conditions.
- All KB peaks eliminated electronically.
- W LA1 (8.40 KeV) lines eliminated from Cu KA1,2 (8.04 KeV) scans even with thoroughly contaminated tubes.
- Common fluorescence energies (i.e. Fe when Cu tube anodes are used) are greatly reduced. (Bremsstrahlung effects are impossible to remove completely)
- Most PSD detectors offer no better than 650eV. This allows for a great deal of fluorescence energy to pass as well as W LA1 from older Cu tubes.
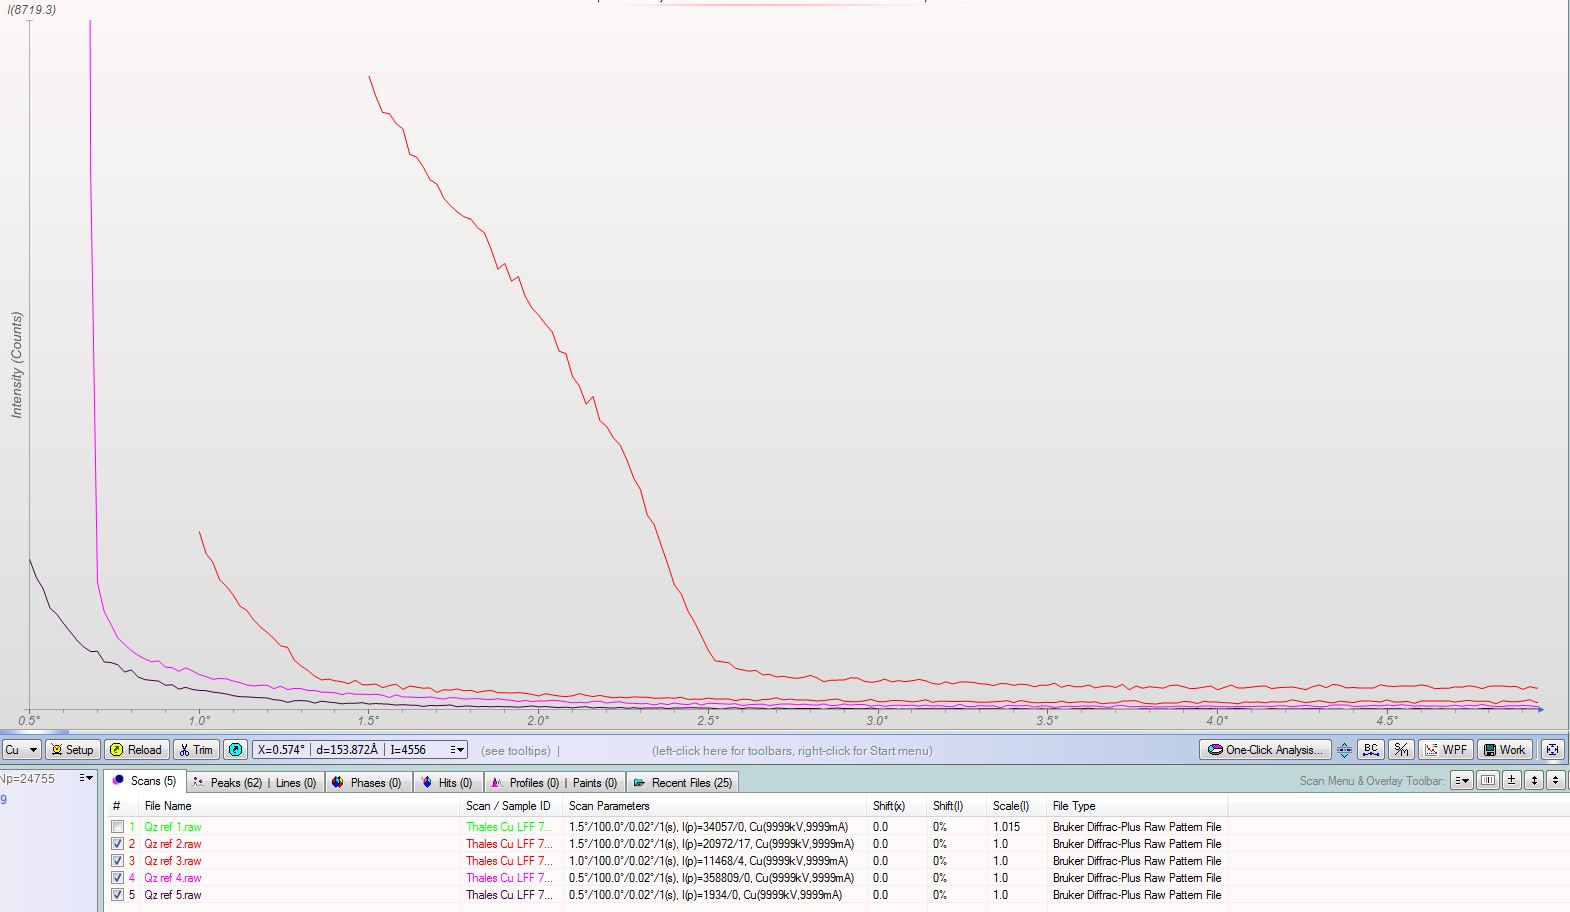
Low angle scatter
- The detector mounts in place of the traditional scintillation counter allowing for use of automated variable (motorized) or interchangeable aperture slits to control angular resolution. Scans starting from 0.5 degrees 2? are possible with the proper slit arrangement just as they are with the scintillation counter. The user controls the intensity vs angular resolution of the scan based upon the ideal conditions for their work rather than the limitations of the hardware.
- Position sensitive detectors are wide open by design which necessitates knife edges over the sample and additional mechanical aperture plates to block air scatter at low angles. Closing off the detector limits the useable channels and reduces the benefit of these detectors dramatically.
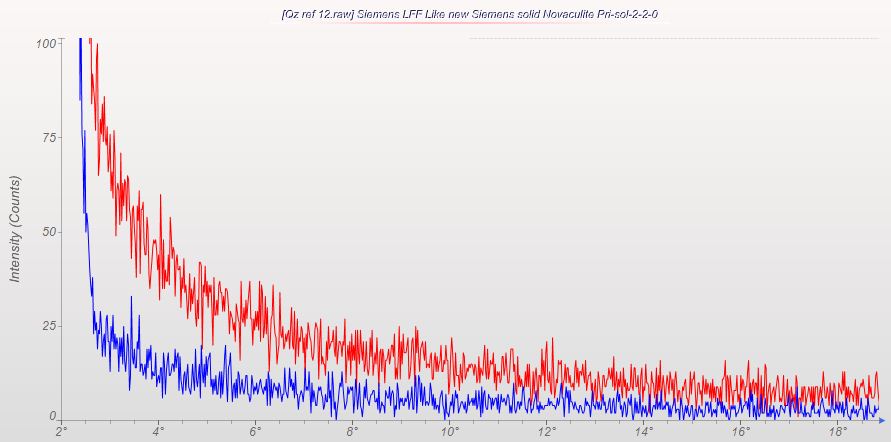
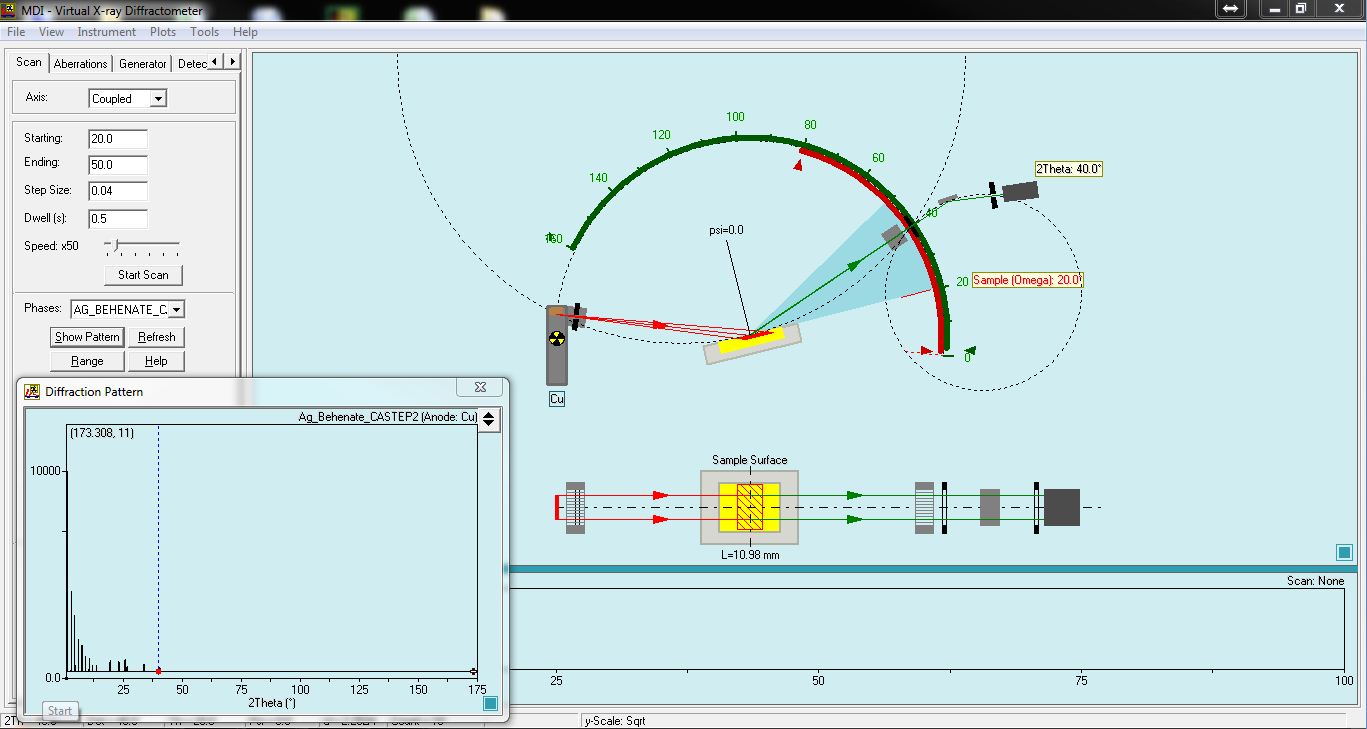
Minimal low angle scatter due to the use of standard aperture slits.

Cu KB1 and W LA1 energies diffract from the 100% peak of Novaculite in between the two primary peaks shown here. Tests with a severely contaminated tube showed no W LA1 passing through the discriminator.
Truly zero maintenance design
- No delays – The detector is ready to collect data almost as soon as power is applied.
- No external cooling – Air backed Peltier cooling eliminates the need for water circulation and/or liquid nitrogen.
- Zero maintenance vacuum design eliminates reliance on an ion pump/backup battery.
- 12 month warranty against hardware failure under normal use.
Versatility
- The Digital Pulse Processor (DPP) includes a usb interface allowing for adjustment and refinement should they be necessary for a particular application. With optional software, full quantitative EDXRF analysis can be performed.
- Compatibility with grazing-incidence attachments and parallel beam optics for analysis of thin films.
The detector can be set for any common XRD anode (energy) easily. Multiple energies may even be configured to allow for use with various anodes without the need for additional hardware. We specialize in Siemens (now Bruker) XRD and WD-XRF instrumention and have installation kits ready for the D500, D5000 and D5005. The output is a standard BNC cable with a 5V square pulse output which is standard across every manufacturer we’ve worked with. Kevex and Thermo Si(Li) detectors used this same output.
Please contact KS Analytical Systems for a quote.